go-callvis
Visualize call graph of a Go program using Graphviz

go-callvis
go-callvis is a development tool to help visualize call graph of a Go program using interactive view.
Introduction
The purpose of this tool is to provide developers with a visual overview of a Go program using data from call graph and its relations with packages and types. This is especially useful in larger projects where the complexity of the code much higher or when you are just simply trying to understand code of somebody else.
Features
- click on package to quickly switch the focus using interactive viewer
- focus specific package in the program
- group functions by package
- group methods by their receiver type
- filter packages to specific import path prefixes
- ignore calls to/from standard library
- omit various types of function calls
Output preview
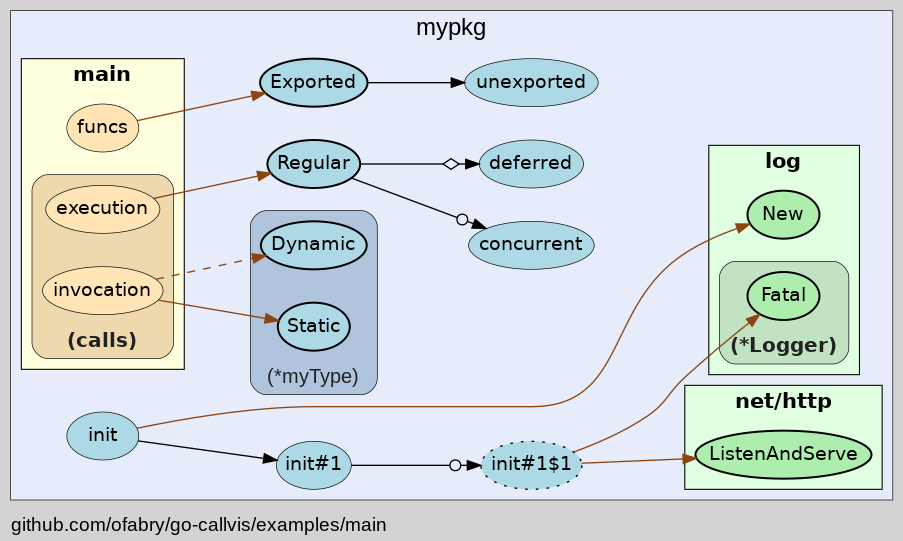
Check out the source code for the above image.
How it works
It runs pointer analysis to construct the call graph of the program and uses the data to generate output in dot format, which can be rendered with Graphviz tools.
Quick start
Installation
Requirements
To install go-callvis, run:
# Latest release
go install github.com/ofabry/go-callvis@latest

# Development version
go install github.com/ofabry/go-callvis@master
Alternatively, clone the repository and compile the source code:
# Clone repository
git clone https://github.com/ofabry/go-callvis.git
cd go-callvis

# Compile and install
make install
Usage
Interactive viewer
To use the interactive view provided by a web server that serves SVG images of focused packages, you can simply run:
go-callvis <target package>
HTTP server is listening on http://localhost:7878/ by default, use option -http="ADDR:PORT" to change HTTP server address.
Render static output
To generate a single output file use option -file=<file path> to choose output file destination.
The output format defaults to svg, use option -format=<svg|png|jpg|...> to pick a different output format.
Options
Usage of go-callvis:
  -debug
    	Enable verbose log.
  -file string
    	output filename - omit to use server mode
  -cacheDir string
    	Enable caching to avoid unnecessary re-rendering.
  -focus string
    	Focus specific package using name or import path. (default "main")
  -format string
    	output file format [svg | png | jpg | ...] (default "svg")
  -graphviz
    	Use Graphviz's dot program to render images.
  -group string
    	Grouping functions by packages and/or types [pkg, type] (separated by comma) (default "pkg")
  -http string
    	HTTP service address. (default ":7878")
  -ignore string
    	Ignore package paths containing given prefixes (separated by comma)
  -include string
    	Include package paths with given prefixes (separated by comma)
  -limit string
    	Limit package paths to given prefixes (separated by comma)
  -minlen uint
    	Minimum edge length (for wider output). (default 2)
  -nodesep float
    	Minimum space between two adjacent nodes in the same rank (for taller output). (default 0.35)
  -nointer
    	Omit calls to unexported functions.
  -nostd
    	Omit calls to/from packages in standard library.
  -rankdir
        Direction of graph layout [LR | RL | TB | BT] (default "LR")
  -skipbrowser
    	Skip opening browser.
  -tags build tags
    	a list of build tags to consider satisfied during the build. For more information about build tags, see the description of build constraints in the documentation for the go/build package
  -tests
    	Include test code.
  -algo string
        Use specific algorithm for package analyzer: static, cha, rta or vta (default "static")
  -version
    	Show version and exit.
Run go-callvis -h to list all supported options.
Reference guide
Here you can find descriptions for various types of output.
Packages / Types
| Represents | Style |
|---|---|
focused |
blue color |
stdlib |
green color |
other |
yellow color |
Functions / Methods
| Represents | Style |
|---|---|
exported |
bold border |
unexported |
normal border |
anonymous |
dotted border |
Calls
| Represents | Style |
|---|---|
internal |
black color |
external |
brown color |
static |
solid line |
dynamic |
dashed line |
regular |
simple arrow |
concurrent |
arrow with circle |
deferred |
arrow with diamond |
Examples
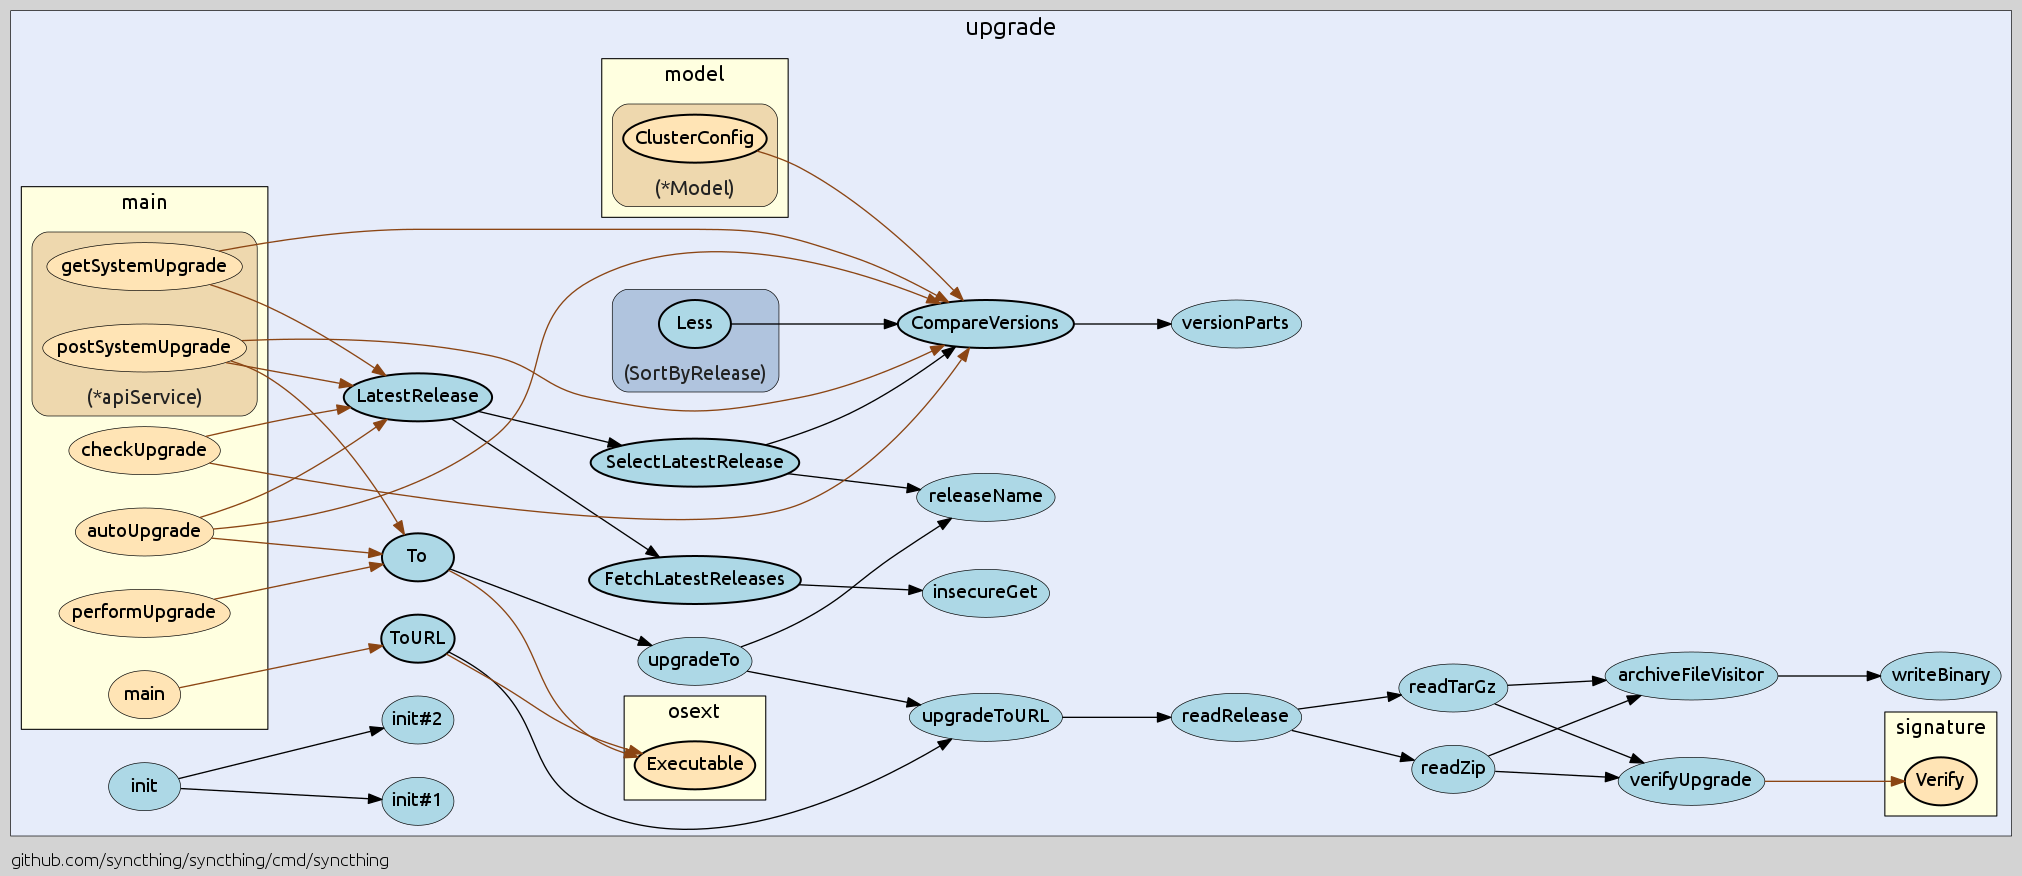
Here is an example for the project syncthing.
Check out more examples and used command options.
Community
Join #go-callvis channel at gophers.slack.com. (not a member yet? get invitation)
How to help
Did you find any bugs or have some suggestions?
- Feel free to open new issue or start discussion in the slack channel.
Do you want to contribute to the project?
- Fork the repository and open a pull request. Here you can find TODO features.
Roadmap
The interactive tool described below has been published as a separate project called goexplorer!
Ideal goal of this project is to make web app that would locally store the call graph data and then provide quick access of the call graphs for any package of your dependency tree. At first it would show an interactive map of overall dependencies between packages and then by selecting particular package it would show the call graph and provide various options to alter the output dynamically.


